
Before I delve into the murky and mysterious world of testing times and so forth, I omitted to mention the change to the scoring system in my last article. Places 1-10 will still get points, but they’ve been weighted slightly to give an extra advantage to winning. Here’s the new set of numbers:
25-18-15-12-10-8-6-4-2-1
Very little between 2nd and 3rd, but a big 7 point jump for winning. Seems like a good idea to me.
Now I’ve got that out of the way, I’ll cast my eye over the latest tests (a second one in Jerez that was a bit wet, and a Barcelona one that’s more useful).
At Jerez Vettel finished top, then 3rd, with Webber also achieving a top spot. Hamilton and Button once each finished in top 2 spots (Button in 1st). The Mercedes was always around 4th/5/6th… middling for a team with title aspirations. The Ferraris varied a bit, with some decent times, but have reportedly been running with a full tank of petrol whilst wearing plate metal armour and having a bike chained to the back.
At Barcelona there was actually some information beyond opaque lap times. Webber helpfully revealed his top spot on day 1 was in a car with 60kg or less of fuel. That equates to a maximum fuel effect of 1.8s. Now, that’s not precise but it does provide a limited window of insight, especially as the Red Bull is probably equal or better than the McLaren and vying with the Ferrari.
Webber’s top slot time was 1:21.487.
This has an absolute maximum fuel effect of 1.8 seconds, and possibly less. So, it’s reasonable to say that any car that can hit the mid 1:20s is competitive, and any that hits the low 1:20s or breaks into the 1:19s may well be shit hot.
The next day Vettel was two-tenths faster. If they’re on the same fuel load that’s good pace, and what I’d expect. Alonso and Hulkenberg both broke into the 1:20.6s, indicating the Williams will be fighting hard for 5th place, and may even get on the podium occasionally.
On day 3 (Day Hard with a Vengeance) Rosberg also scored a 1:20.6, some good news for Mercedes, who are perhaps not as racey as they’d been expecting.
Day 4 saw the fastest testing, with many cars definitely on low fuel. A stack of cars hit the 1:20s. Hamilton and Webber had 1:20.4s, Massa a 1:20.5, Sutil in the Force India got 1:20.6 as did Vettel, Schumacher got 1:20.7, Barrichello got 1:20.8, and Kobayashi got 1:20.9. Now, we don’t know fuel loads, and if Schumacher had 10kg more than Hamilton and Webber then their pace is equal. But it’s reasonable to say that the Force India almost certainly exceeded expectations, as did Hulkenberg’s Williams two days previously.
I think Massa is worth a punt at 10/1 (present Betfair price). Alonso probably should be favourite but the discrepancy in odds (3.6 to 11) is ridiculous.
I’ll be watching Schumacher’s price (if Mercedes start slowly to the season it may lengthen to silly proportions) over the first few races. For qualifying, my eyes will be most firmly on Hulkenberg (new driver in a Williams should have long odds, but some of his testing has been good) and Sutil/Kobayashi (Force India and Sauber have been looking tasty too). Obviously I’ll be considering practice times, and it’ll be interesting to see how the teams divvy up drivers and fuel loads for free practice.
There are a lot of unknowns going into Bahrain in less than a fortnight. I’ll be paying attention to see whether any team has a particular good launch system, and whether the first corner sees a lot of crashes as a large number of slow, long cars get clogged up.
All things being equal, I intend to try and write pre-qualifying, pre-race and review posts for each race, so my next post will be on the 13th of March shortly after P3 and well before Q1.
Morris Dancer
Sunday 28 February 2010
WattsUp with YouGov? Haven’t we Been Here Before?
In this article following on from Flockers on the main site last Friday I want to see whether there are parallels between the excessive reliance on black-box computer modelling in the Climate Change debate and the way in which the pollsters use models to systematically reweigh the raw polling data.

Whenever you go and collect data and do an initial analysis on it, there’s always one reason or another why it just doesn’t seem to fit with expectations. Perhaps there have been some gaps in the data? Or perhaps one series of data points seems to be over-represented? So, it’s the most natural thing in the world for the statistician to seek to fill-in or even-out these gaps, perhaps by reference to some sort of historical pattern or even by some sort of fudge-factor until the result seems more sensible and in-line with what you’d expect.
And, of course that’s what Phil Jones at his colleagues at the University of East Anglia just down the road from me did for about 15 years with his climate change models.
With hindsight it’s fairly easy to see that Jones and his colleagues had bought into a fixed notion that temperatures would be expected to rise as the amount of CO2 in the atmosphere increased. And so he designed his models accordingly. And then he got into a series of positive-feedback loops that progressively increased and then exaggerated the minor increases in the temperature record to fit into the peer-reviewed collective wisdom.
It didn’t matter that the fastest rises in CO2 occurred in the mid-1800’s [Krakatoa?] or that the weather during the Battle of Hastings was warmer than today [the Medieval Warm Period], a narrative had taken hold and people then became so engrossed in the computer models and their assumptions that they forgot to look out of the window to see what was really happening outside.
So, are the 2010 political polling reflecting what we’re seeing as we look out of our own windows? Is this poll narrowing really reflecting the conversations we’re having with colleagues at work or in the pub?
Have the Pollsters’ models got out of kilter with what we’re experiencing on the ground? Which is why I want an answer to Richard Tyndall’sKellner Killer Question from February 20th, 2010 at 10:06 pm.
But before I highlight a worked example, let’s just get some things straight so you don’t characterise me as a Climate-Change or Polling denier. Let’s review some of the events of the last few weeks.
• As Bob Worcester says, it’s the share, not the lead that’s important. You only need a majority of one to win a seat. It’s clear that the Tory’s lead has narrowed over the last few weeks, even if their share has remained quite stable in the 38-40pc range.
• Labour’s share has increased. It’s been wall-to-wall Labour on the telly so Mike’s third rule applies: The more you’re on the box, the better you do in the polls. Their improvement over the last week seems to partly prove the saying that ‘There’s no such thing as bad publicity’.
• The LibDems have dropped and are flat-lining at 17/18pc and their misfortune has been Labour’s gain. The LibDems and Labour seem to be fishing in the same pool. As the LibDem vote falls, Labour’s rises, which has contributed most of all to Labour’s recovery.
• We also know that all-of-a-sudden Labour is doing substantially better in Scotland at the expense of the SNP so in aggregate over the whole of Great Britain, Labour’s percentage is higher. It’s debatable whether the increase is reflected in the English Towns, where the battle will be won or lost.
Oh yes and we also know a few weeks ago YouGov changed their weighting methodology in preparation for their daily polls, noting that Tory voters tended to respond more quickly to invitations-to-survey and older voters often missed-out because they only check their emails every few days.
The goalposts just got moved. Someone at YouGov just pressed the ‘Reset’ button. What’s the effect of this been?
So, let’s have a look at one of the recent polls by having a close look at the YouGov results from 25th February, for which fieldwork was conducted on 23/24th February.

First of all, the sample was reported to be 1473. Of the 1473 sample, the ‘Headline’ result was said to be Con 38%; Lab 32%; LibDem 19%; Others 10%, amounting to 99% with rounding errors. This excludes the don’t knows and the will not vote.
Of the 1473 sample just over 400 respondents were either in the others [10%], will not vote [7%] or undecided/Don’t know [13%] categories. That surprised me and suggests that all the parties still have a lot to play for. With 10% on ‘others’ and 20% of voters undecided, it’s still Game-On for the big parties.
The press is lapping-it-up. The Hung Government narrative sells papers.
Now, the pollsters job is to try and predict the national share. But is estimating the national share the same as predicting the result of the election? Andy Cooke has been postulating that the marginals are behaving differently and Blair Freebairn’s suggested that the key battleground is the METHHs, the medium English Towns and their hinterland. I agree.
So, now I’m going to do something controversial to illustrate a point. Just hear me out while I construct this straw man. There’ll be plenty of people lining-up to demolish it in the comments so I’ll put my tin hat on now!
I’m going to make the simplistic point that in the English METHH marginals, the battle is going to be a three-way fight. The contaminating effect of the nationalist parties in Scotland and Wales [SNP/PC] will be zero. I’m also going to make the intellectual leap that in a ‘change’ election, UKIP and the Greens [except Brighton & Norwich South] will be squeezed too.
So let’s just see what happens in what’s left of the YouGov weighted sample when we discount all except those who say they’ll vote for the main parties. In this scenario, what’s left are 1057 [71% of the whole sample] respondents out of the original 1473. I’m going to suggest that this forms a proxy for the 3-way English-Town fight, where the battle will be won or lost.
In the 1046 Raw Sample, there were 496 [47%] Con; 333 [32%] Lab & 217 [21%] LibDem. In 1057 weighted Headline Result, there were 453 [43%] Con; 375 [35%] Lab & 229 [22%] LibDem. Oooh. That's a big difference between the two!
In the weighted-sample three-main-parties-only figures, the Tories are 8% ahead… and that’s including Labour’s Scottish vote, which we know is disproportionately high north of the border and irrelevant for the METHHs. In the unweighted one, they're 15% clear.
Interestingly these are pretty similar results to the Angus Reid polls that have been studiously ignored by the national press, which have showed an additional swing over-and-above in the marginals.
In the weighted result, the Tories have been scaled-back from 496 to 452 [-43] and Labour improved from 333 to 375 [+42]. The LibDems have been boosted by 12 moving from 217 to 229. That represents a swing away from the Tories to Labour across the whole country of 5.7%. That’s quite a difference in a poll that gave the Tories a 6% lead.
If we accept that the 3-way fight is a proxy for the METHHs, for the Tories, there is still some comfort in the polls. They’re ahead where they need to be but it's still squeaky-bum time. Their campaign has faltered by firing out a series of policies in a scattergun approach without communicating a core narrative since January. It’s has been exposed as a great mistake, which is being punished.

But this weekend allows them to press their own ‘Reset’ button before the voters become engaged in the campaign proper.
I fully accept that the pollsters must re-weight their samples and the way in which they do this is their intellectual property and the value in their business. And it’s good business. I’ve used YouGov myself. And been pleased by the results.
But today's gap apparently narrowing to 2%, betting money at stake, and the future of the country hanging in the balance, we’re putting a lot of trust in the YouGov computer models, which have been recently tweaked. Are the tweaks, in this case resulting in a 5.7% Con-Lab swing over-cooking it? The Tories were 6% ahead overall. The weighting is as much as the lead. It's non-trivial.
We know what’s going on here: Pollsters know that, back in 2005 a certain proportion of people backed Labour. This year the pollsters are calling voters and not as many people are saying that they’re voting Labour as before. We can see that in the raw data.
So, it may well be that either a large number of people reallyaren’t going to vote Labour after all. Or the pollster may infer that, on an historical basis, his sample is just under-weight in Labour supporters and increase the Labour share with technical adjustments over-and-above normal demographic/occupational adjustments to align with the long-term model trend.
And if so, this is the fudge-factor. This is Dr Jones’ of the UEA “Mike’s Nature Trick”. That fudge in this case amounts to 5.7%. It needs to be explained.
Which brings me back to my initial point. Are there parallels here between the muddle with the scientists down the road at the UEA over ClimateGate and what we’re seeing here? Are we seeing too much reliance on black-box systems, whose complexity is now divorcing them from the system that they’re trying to model?
I’m not having a pop at YouGov. I don’t know the answer but you’ll excuse me from posing the question with a seeming 5.7% structural adjustment being applied.
As Political Punters, we now have a judgement call to make safe in the knowledge that if things generally look too good to be true, then they are normally are too good to be true.
• Do the national voting intentions accurately reflect the likely result of the election in 640 seats?
• Is the evidence of our own eyes telling us that only one voter in twenty has changed their mind since 2005?
• Do we trust the black-box polling models when the weightings are so large. Are they arbitary?
• How much of the polling is science and how much of prediction is art. And is this why the betting markets have been relatively stable over the last few weeks.
Peter Kellner’s coming on the site on Tuesday. I hope that this thread can collate the questions that we need to ask him.

Whenever you go and collect data and do an initial analysis on it, there’s always one reason or another why it just doesn’t seem to fit with expectations. Perhaps there have been some gaps in the data? Or perhaps one series of data points seems to be over-represented? So, it’s the most natural thing in the world for the statistician to seek to fill-in or even-out these gaps, perhaps by reference to some sort of historical pattern or even by some sort of fudge-factor until the result seems more sensible and in-line with what you’d expect.
And, of course that’s what Phil Jones at his colleagues at the University of East Anglia just down the road from me did for about 15 years with his climate change models.
With hindsight it’s fairly easy to see that Jones and his colleagues had bought into a fixed notion that temperatures would be expected to rise as the amount of CO2 in the atmosphere increased. And so he designed his models accordingly. And then he got into a series of positive-feedback loops that progressively increased and then exaggerated the minor increases in the temperature record to fit into the peer-reviewed collective wisdom.
It didn’t matter that the fastest rises in CO2 occurred in the mid-1800’s [Krakatoa?] or that the weather during the Battle of Hastings was warmer than today [the Medieval Warm Period], a narrative had taken hold and people then became so engrossed in the computer models and their assumptions that they forgot to look out of the window to see what was really happening outside.
So, are the 2010 political polling reflecting what we’re seeing as we look out of our own windows? Is this poll narrowing really reflecting the conversations we’re having with colleagues at work or in the pub?
Have the Pollsters’ models got out of kilter with what we’re experiencing on the ground? Which is why I want an answer to Richard Tyndall’s
But I do have doubts about these Yougov daily polls. The difference between the pre and post weighting numbers seems to me to be unjustified and I would like to see this confirmed by a ‘real’ poll before saying whether or not the Tories are getting what they deserve for their recent mishandling of policy.
But before I highlight a worked example, let’s just get some things straight so you don’t characterise me as a Climate-Change or Polling denier. Let’s review some of the events of the last few weeks.
• As Bob Worcester says, it’s the share, not the lead that’s important. You only need a majority of one to win a seat. It’s clear that the Tory’s lead has narrowed over the last few weeks, even if their share has remained quite stable in the 38-40pc range.
• Labour’s share has increased. It’s been wall-to-wall Labour on the telly so Mike’s third rule applies: The more you’re on the box, the better you do in the polls. Their improvement over the last week seems to partly prove the saying that ‘There’s no such thing as bad publicity’.
• The LibDems have dropped and are flat-lining at 17/18pc and their misfortune has been Labour’s gain. The LibDems and Labour seem to be fishing in the same pool. As the LibDem vote falls, Labour’s rises, which has contributed most of all to Labour’s recovery.
• We also know that all-of-a-sudden Labour is doing substantially better in Scotland at the expense of the SNP so in aggregate over the whole of Great Britain, Labour’s percentage is higher. It’s debatable whether the increase is reflected in the English Towns, where the battle will be won or lost.
Oh yes and we also know a few weeks ago YouGov changed their weighting methodology in preparation for their daily polls, noting that Tory voters tended to respond more quickly to invitations-to-survey and older voters often missed-out because they only check their emails every few days.
The goalposts just got moved. Someone at YouGov just pressed the ‘Reset’ button. What’s the effect of this been?
So, let’s have a look at one of the recent polls by having a close look at the YouGov results from 25th February, for which fieldwork was conducted on 23/24th February.

First of all, the sample was reported to be 1473. Of the 1473 sample, the ‘Headline’ result was said to be Con 38%; Lab 32%; LibDem 19%; Others 10%, amounting to 99% with rounding errors. This excludes the don’t knows and the will not vote.
Of the 1473 sample just over 400 respondents were either in the others [10%], will not vote [7%] or undecided/Don’t know [13%] categories. That surprised me and suggests that all the parties still have a lot to play for. With 10% on ‘others’ and 20% of voters undecided, it’s still Game-On for the big parties.
The press is lapping-it-up. The Hung Government narrative sells papers.
Now, the pollsters job is to try and predict the national share. But is estimating the national share the same as predicting the result of the election? Andy Cooke has been postulating that the marginals are behaving differently and Blair Freebairn’s suggested that the key battleground is the METHHs, the medium English Towns and their hinterland. I agree.
So, now I’m going to do something controversial to illustrate a point. Just hear me out while I construct this straw man. There’ll be plenty of people lining-up to demolish it in the comments so I’ll put my tin hat on now!
I’m going to make the simplistic point that in the English METHH marginals, the battle is going to be a three-way fight. The contaminating effect of the nationalist parties in Scotland and Wales [SNP/PC] will be zero. I’m also going to make the intellectual leap that in a ‘change’ election, UKIP and the Greens [except Brighton & Norwich South] will be squeezed too.
So let’s just see what happens in what’s left of the YouGov weighted sample when we discount all except those who say they’ll vote for the main parties. In this scenario, what’s left are 1057 [71% of the whole sample] respondents out of the original 1473. I’m going to suggest that this forms a proxy for the 3-way English-Town fight, where the battle will be won or lost.
In the 1046 Raw Sample, there were 496 [47%] Con; 333 [32%] Lab & 217 [21%] LibDem. In 1057 weighted Headline Result, there were 453 [43%] Con; 375 [35%] Lab & 229 [22%] LibDem. Oooh. That's a big difference between the two!
In the weighted-sample three-main-parties-only figures, the Tories are 8% ahead… and that’s including Labour’s Scottish vote, which we know is disproportionately high north of the border and irrelevant for the METHHs. In the unweighted one, they're 15% clear.
Interestingly these are pretty similar results to the Angus Reid polls that have been studiously ignored by the national press, which have showed an additional swing over-and-above in the marginals.
In the weighted result, the Tories have been scaled-back from 496 to 452 [-43] and Labour improved from 333 to 375 [+42]. The LibDems have been boosted by 12 moving from 217 to 229. That represents a swing away from the Tories to Labour across the whole country of 5.7%. That’s quite a difference in a poll that gave the Tories a 6% lead.
If we accept that the 3-way fight is a proxy for the METHHs, for the Tories, there is still some comfort in the polls. They’re ahead where they need to be but it's still squeaky-bum time. Their campaign has faltered by firing out a series of policies in a scattergun approach without communicating a core narrative since January. It’s has been exposed as a great mistake, which is being punished.

But this weekend allows them to press their own ‘Reset’ button before the voters become engaged in the campaign proper.
I fully accept that the pollsters must re-weight their samples and the way in which they do this is their intellectual property and the value in their business. And it’s good business. I’ve used YouGov myself. And been pleased by the results.
But today's gap apparently narrowing to 2%, betting money at stake, and the future of the country hanging in the balance, we’re putting a lot of trust in the YouGov computer models, which have been recently tweaked. Are the tweaks, in this case resulting in a 5.7% Con-Lab swing over-cooking it? The Tories were 6% ahead overall. The weighting is as much as the lead. It's non-trivial.
We know what’s going on here: Pollsters know that, back in 2005 a certain proportion of people backed Labour. This year the pollsters are calling voters and not as many people are saying that they’re voting Labour as before. We can see that in the raw data.
So, it may well be that either a large number of people reallyaren’t going to vote Labour after all. Or the pollster may infer that, on an historical basis, his sample is just under-weight in Labour supporters and increase the Labour share with technical adjustments over-and-above normal demographic/occupational adjustments to align with the long-term model trend.
And if so, this is the fudge-factor. This is Dr Jones’ of the UEA “Mike’s Nature Trick”. That fudge in this case amounts to 5.7%. It needs to be explained.
Which brings me back to my initial point. Are there parallels here between the muddle with the scientists down the road at the UEA over ClimateGate and what we’re seeing here? Are we seeing too much reliance on black-box systems, whose complexity is now divorcing them from the system that they’re trying to model?
I’m not having a pop at YouGov. I don’t know the answer but you’ll excuse me from posing the question with a seeming 5.7% structural adjustment being applied.
As Political Punters, we now have a judgement call to make safe in the knowledge that if things generally look too good to be true, then they are normally are too good to be true.
• Do the national voting intentions accurately reflect the likely result of the election in 640 seats?
• Is the evidence of our own eyes telling us that only one voter in twenty has changed their mind since 2005?
• Do we trust the black-box polling models when the weightings are so large. Are they arbitary?
• How much of the polling is science and how much of prediction is art. And is this why the betting markets have been relatively stable over the last few weeks.
Peter Kellner’s coming on the site on Tuesday. I hope that this thread can collate the questions that we need to ask him.
Monday 22 February 2010
The M1 Truels
Ever since the dawn of civilisation, man has sought to see patterns in apparent randomness. When he looked up to the skies, he linked the stars together to form constellations. (Woman, of course, is much more sensible). The same danger applies when discussing disparate constituencies. With that note of caution, I'm going to talk about seven apparently-unconnected constituencies with a surprising amount in common: Hampstead & Kilburn; Watford, St Albans, Bedford, Northampton North, Derby North and Leeds North West.
So what do these seven have in common? All are three-way marginals. All are seats which the Conservatives either hold or would be taken with a swing of the size needed to get the Tories a working majority (taking all seats up to Derby North would give the Tories a majority of 38). The Tories are runaway favourites in none of them. I attach a table with the best odds on all of these seats and details of the last election results:
http://docs.google.com/Doc?docid=0ASgi8eZw-4q1ZGRkcXR2ZmdfMTVmN2hucHoyZw&hl=en
All seven lie on or near to the M1. So, showing my customary imagination, I'm calling them the M1 truels. What's a truel? It's a three-sided duel, popular in game theory. In classical examples, each competitor takes turns to shoot at an opponent. Politics isn't as gentlemanly as game theory and all competitors are coming out guns blazing all the time. This makes determining tactics for the competitors and the ultimate outcome rather more difficult.
To revert to my star-studded metaphor at the start of this piece, some star clusters are genuinely linked, and some that appear close are not. My group of seven includes five constituencies that have genuine important similarities and two that are quite different. The interlopers are Hampstead & Kilburn and Leeds North West - traditional Lib Dem areas of focus with a high student/graduate populations in relatively wealthy suburbs of large urban areas. I do not propose to look at them in more detail. (For what it's worth, I think the Lib Dems are a lock in Leeds North West and that the value in Hampstead & Kilburn is with the Tories, but there are whole other articles there).
The other five constituencies are much more interesting, because I believe that they represent something new in English politics. Watford, St Albans, Bedford, Northampton and Derby have much in common. All of them, as I originally pointed out, are close to the M1. None are noted intellectual or academic centres. All are prosperous enough. None are particularly posh or glamorous. All of them, in fact, look like typical towns which swing back and forth between the Tories and Labour. None of them look like the types of seats where the Lib Dems usually get a look in. So why do we suddenly have this string of three-way marginals?
I suggest that the answer lies in two successive political failures: one by the Conservatives and one by Labour. The first failure is a Conservative failure. In 2005, many English voters south of the Mersey and the Wash were turning their backs on Labour. But they did not feel ready to endorse the Conservatives. The second failure is a Labour failure. In 2010, many of Labour's 2005 voters remain repelled by the Conservatives. But they no longer feel that they can vote for Labour. As a result, the Lib Dems in two steps have managed to get themselves into serious contention in these seats.
It is startling that this has had so little comment. Watford has been much talked-about as a constituency, but only because of its exceptional tightness. Yet St Albans - a seat the Tories already hold, remember - is available at a best price of 2/5 - only slightly shorter than the price that you can get on a Tory overall majority. The Tories should be miles ahead in a seat like this. The Tories, second to Labour in both Northampton North and Bedford and needing both on a uniform national swing to be the largest party, are at a best price of 2/5 and 2/1 respectively. Typically, the Tories are quoted at 1/12 to be the largest party.
I suggest that in those seats where the Tories are in second to Labour, they really should take these this time around. The Lib Dems will need to do an exceptional job persuading disaffected Labour voters that only the Lib Dems can stop the Tories - while it may be true, most loyal Labour voters will find it hard to credit when the seat is held by a Labour MP. The possible exception is Bedford, where the example of a Lib Dem mayor may do the trick. The Tories seem complacent in both Bedford and Northampton North. This is playing with fire.
Where the Tories are third - in Watford and Derby North - the job is easier for the Lib Dems. It is probably an easier message for the Lib Dems to get across in Watford than in Derby North. The Tory 5/4 shot in Derby North may be more likely to come home than the 10/11 shot in Watford. Personally, I don't intend betting on either.
Perhaps the most interesting seat is St Albans. On the face of it, the Tories should win this one easily. And yet. With an MP caught up in the expenses scandal but not retiring and an easy task for the Lib Dems persuading Labour supporters to back them instead, this one could be tight. I'm tempted to back the Lib Dems here.
I'm not putting any money on Labour in any of these seats. The odds are long for a reason. I anticipate that Labour will come out of the general election in third place in most or all of these seats. Once the Lib Dems are entrenched as the opposition to the Tories in these seats, they will be hard to shift. And if they can manage it in traditional Labour/Tory marginals like these, can they repeat the trick in other areas? If they can, the long battle on the left of centre may be about to enter a new phase.
antifrank
Alternative Seat Calculator - instructions/link
Seat Calculator – Instructions and Warnings
Firstly – a warning. All models of an event as complex as the General Election will be unavoidably simplified – if for no other reason than the data required to genuinely forecast the outcome (the correct knowledge of opinion in each one of the 650 seats) is unavailable. Treat all models – this one included – with appropriate scepticism. It is intended to inform your opinion of what’s going to happen. Please also remember that by-election victories are not taken into account – so the Conservative performances in Crewe and Nantwich and Norwich North, The Lib Dem performance inDunfermline and West Fife and the SNP performance in Glasgow East will certainly exceed a model forecast. This model is based on the notional figures provided by Anthony Wells. 
Firstly – a warning. All models of an event as complex as the General Election will be unavoidably simplified – if for no other reason than the data required to genuinely forecast the outcome (the correct knowledge of opinion in each one of the 650 seats) is unavailable. Treat all models – this one included – with appropriate scepticism. It is intended to inform your opinion of what’s going to happen. Please also remember that by-election victories are not taken into account – so the Conservative performances in Crewe and Nantwich and Norwich North, The Lib Dem performance in
The calculator can be found here (https://docs.google.com/fileview?id=0B9UJxqag_hMyNGI2NmIwOTUtNjFlMC00ZWRlLWE5MDEtMjRkNjExNDZmYTZl&hl=en)
Differences between this model and a UNS swing calculator
Probabilistic nature: In UNS calculators, if the required swing is 6.5% and the polls project 6.4%, hard luck. You missed that constituency (it stays in the original column). In reality, the swings do not go uniformly. Instead of a needle swinging on a semicircle with seats clustered in accordance with their majorities, visualise a kind of fuzzy fan – denser in the centre, wispier towards the sides, a few swing-points wide. This fan covers a lot of the seats, and the density of the coverage corresponds to the chance of the seats there changing hands or being retained. Out of a group of 18 seats 3 points beyond the swing (so with a projected majority of 6 percent after the swing), three should change hands. Similarly, with seats that should be well taken, with majorities for the attacker of 6 points after the swing, a sixth of them will be retained against the tide. (These figures are indicative of typical Lab/Con swing standard deviations). This calculator takes them into account. Those seats that are “one standard deviation” beyond the swing would be counted for the attacker as 1/6th of a seat each (as the attacked should claim a sixth of them). Those that are (for example) one standard deviation inside the swing will only count 5/6ths each for the attacker – as one in six should be retained by the defender.
Adjustability. It’s a probabilistic UNS calculator with knobs on. These knobs can be twiddled to:
- Have different swings in
- Adjust for tactical voting and tactical voting unwind
- Allow for the “constituency effect”
- Allow for the differential performance of marginal constituencies
- Specify chances of minor party victories in 6 selected constituencies
Updates/changes/refinements. There won’t be any more – it’s as smooth as I can make it now and has enough knobs on to satisfy everyone (surely?). Changes made since my earlier articles:
- The Speaker is not counted in the numbers of the party from which he came, unlike as shown in the BBC figures for previous elections. In earlier versions of the calculator, I followed the BBC’s convention, but bearing in mind that betting firms will probably insist on actual party counts, I feel this should be more appropriate.
- The SNP and Plaid Cymru are properly modelled – they were more crudely allocated in the earlier model and the battlegrounds in
- The probabilistic function was made fully continuous, rather than discrete levels using a lookup table. This reduces the amount of “long shots” that could come off. There’s an “effective majority” figure/percentage chance. This assumes 5 Sinn Fein MPs and that the Speaker and 3 Deputy Speakers do not vote other than to break a tie in accordance with Parliamentary procedures.
- The marginal effect rebound for the Conservative/Labour battles was levelled off somewhat and rounded down to half-percentage points.
- A Lib Dem incumbency effect was added.
Instructions for use
The calculator looks complex, but has three distinct areas. As a rule of thumb, faded colours tend to signify information; brighter colours signify areas for you to enter/adjust figures The top section is for input.

Where it says “Current poll”, put in the current polling scores, or the score you want to investigate.
Below that are separate input boxes for
The “Rewind Factor” boxes control how much the electoral pendulum is assumed to “rebound” as the distorting pressures that produced the electorally distorted effects in the marginals over the 1997 and 2001 elections are removed – if you assume that the rewind effects (constituency factor, tactical voting unwind, marginal effects) for the Conservative-Labour battleground will not be as effective (or will be more effective) in the respective countries, adjust that as you see fit. Note that this control is solely for the Conservative/Labour battleground.

To the right are separate entries for six selected “unmodellable” constituencies, where minor parties (IKHH, Blaenau Gwent People’s Voice, Respect, Greens, UKIP and the BNP) are either defending seats or are making realistic challenges. For these, you have to estimate the chances of each entry winning there (e.g. in Wyre Forest, the chances of Dr Taylor hanging on, of the Conservatives winning, of Labour winning and of the Lib Dems winning). This is not an estimate of polling scores but of the probability of that candidate winning. If the score does not add up to 100% (it’s assumed that one of the parties shown will win), the score to the right will light up in red until rectified.
Below all of this is the output section.

The calculated results are presented. As the model is probabilistic, the central prediction (“Predicted Seat Total”) is usually a number with a decimal point. That is where the centre of the “smeared out” forecast should be. The standard deviation is a measure of the range of the forecast by probability. If the same election were run with the same figures a hundred times, the average scores for each party would be as per the central figure. Sixty-eight of the hundred would fall in the “68% interval”. Ninety five of these hundred alternate universe elections would end up with scores inside those defined by the “95% interval”.
The quoted majority is for the whole number of seats closest to the central forecast. The “effective majority” presumes 5 Sinn Fein MPs and that the Speaker and three Deputy Speakers do not vote on party grounds.
The “% majority” and “% Effective majority” figures estimate the likelihood of the party gaining a majority or effective majority respectively. After all, if the majority forecast is very low, a number of alternate universes will be ones in which the leading party just fails to get across the line – this figure reflects that.
If you wish to see in detail how the parties did in

This shows the central forecast only, for each country. To get the range, use the convention that +/- 1 standard deviation (sd) is a range with 68% likelihood and +/- 2 standard deviations has about a 95% likelihood.
To the right of the output are the core assumptions used. Firstly, the “swing standard deviations”

This is a measure of how variable are the “random” fluctuations about the average swing.
The LabàCon swing, for example, will not be uniform but will vary about the average. This measurement of how variable it is has varied from 2.4 to 3.4% for Lab-Con swing over the past 5 elections. It will probably tend to the higher end for the next election, which is based on notional constituency scores. For Labour-Lib Dem and Conservative-Lib Dem swings, they tend to be fractionally higher (3.6-4.0 and 3.0-3.3 respectively). The swings involving SNP and Plaid Cymru are set to a figure of 3.0 each.
ASSUMPTION: That the swing standard deviation will be the average for the last five elections. As said, a slightly higher figure might be assumed. This will slightly change the forecast.
Next, the specific systematic distortions. A certain level has built up since the election was called in 1997.

The “Constituency adjustment” figure reflects that the average constituency size and turnout is not uniform. In Lab-Con fights, it tends to be that the lower turnout of Labour core voters (and lower changes in their voting patterns) in Labour-held safe seats and higher in Conservative safe seats usually acts to assist the Labour vote when they are improving in the marginals and semi-marginals and detract from it when it is falling. The accumulated effect since 1997 is about half-a-percent.
ASSUMPTION: That this effect will unwind over a national swing sufficient to return the parties to their 1992 position.
This can be adjusted as the user sees fit. There does not appear to be any distinct pattern in the effect in Lab/LD and Con/LD battles, but the facility is there for balance.
The tactical voting adjustment is entered next.
A positive figure in the “Con-Lib” column signifies Conservative voters lending their votes to the Lib Dems to keep out Labour in Lib Dem/labour fights; a negative figure in this column indicates a net transfer from Tories to Labour to keep out Lib Dems.
A positive figure in the Lab-Lib column helps the Lib Dems against the Conservatives on a further winding up of the existing anti-Tory tactical voting; a negative figure helps the Conservatives against the Lib Dems and signifies an unwinding of the tactical voting in Lib Dem/Conservative battles.
A positive figure in the Lib-Lab column would signify that the tactical voting is actually increasing in Labour/Conservative marginals, a negative figure that it is unwinding.
The Lib Dem voters who lent their votes to Labour in order to “keep out the Tories”, or “kick out the Tory” are assumed not to be as motivated to vote for their formerly second-choice party. The national swing starts from a point assuming that they will repeat their tactical vote. For the Lib Dem à Labour tactical voters, the baseline amount left voting Labour in 2005 was calculated to have the same effect as about a 0.5% distortion of the national swing in favour of Labour, in Conservative/Labour fights.
ASSUMPTION: That the “detoxification” of the Conservative party, as evinced by “forced choice” questions, has unwound this effect.
The next effect is the most crucial: The marginal battleground boost.
Since the advent of Tony Blair and New Labour, the Labour Party have tended to outperform the national swing in the seats they most needed. The potential reasons are manifold: particular attraction to the centrist and floating voters most found in marginals and semi-marginals (“Mondeo Man” and “Worcestor Woman”), concentration of the tactical voting effect where it is most needed, more money spent in the most important seats, higher activist usage, etc), but the outcome is that in these seats, since 1997, the distortion of the UNS has built up considerably. The forces acting to hold this distortion in place have been arguably removed – the “forced vote” question and other polling questions have demonstrated that the Conservatives are no longer seen as being so repellent to centrist/floating voters (and indeed seem to have reversed the effect slightly). Tactical voting should unwind, and the concentration in the marginals should also unwind. Activist levels, party targeting and money spent in marginals now definitely do not benefit the Labour party as they did before. The effect is most pronounced in the most marginal seats and recedes as the swing required increases. All of these figures can be adjusted by the user.
In LD v Con marginals, LD-held seats are at the bottom of the table; Con-held seats at the top. Positive is good for Lib Dems; negative is good for Conservatives.
In Lab v Con seats, Lab-held seats are at the bottom of the table; Con-held seats at the top. Positive is good for Labour; negative is good for Conservatives.
In Lab v LD seats, Lab-held seats are towards the bottom of the table; LD-held seats at the top. Positive is good for Labour; negative is good for Lib Dems.
ASSUMPTION: That the effect in Con/Lab marginals will unwind . THIS IS THE MOST IMPORTANT ASSUMPTION – VARYING THIS ONE WILL HAVE THE GREATEST EFFECT.
Note that only the relevant figures for the Conservative-Labour battles are included in detail The other figures have not been produced due to small sample size and minimal pattern emerging – although the Liberal Democrats do seem to do better in their relevant marginals and have a definite trend of performing well in close incumbent battles. Therefore a boost has been assumed for defending Lib Dem MPs. The user may enter whatever figures he/she deems appropriate. There is also a possibility of Conservative -> Liberal tactical voting.
Historically, Lib Dem MPs have been reportedly hard to shift when they have won their seats. This effect seems borne out by the data, and so a “defence boost” for Lib Dem held seats (against both other parties) is assumed.
ASSUMPTION: That there will be a “defence boost” to Lib Dem-held incumbent seats.
Please note that all of these assumptions should be carefully weighed by the user. If you feel that the effect is too large to be unwound in a single election (or even that it has been countered or will remain), the easiest thing to do is to adjust the grey “rewind factor” boxes next to the polling scores. Reducing these to zero will eliminate the Conservative-vs-Labour rewind effect completely (although not the Lib Dem defence boost). If you ensure that all of the assumptions are set to zero, this spreadsheet can be used simply as a probabilistic UNS calculator.
(Edit - these instructions have been uploaded as a Word document here on Google Docs)
Sunday 21 February 2010
The Scottish play
Earlier in the week I posted a list of Conservative target seats by swing and by odds. In this post, I am going to have a look at the Scottish seats by each party's targets. I freely admit that I have been to Scotland the grand total of a dozen or so times in my entire life and never for longer than five days at a time. So I claim no personal inside knowledge on any seat. But sometimes an outsider can see things more clearly than locals. I hope so, because I have the feeling that this thread is going to upset a lot of people.
Let's start with the Tories. The Tories have 14 of their top 200 targets in Scotland. This is rather more than is sometimes appreciated. Here they are listed in order of their best-priced odds:
http://docs.google.com/Doc?docid=0ASgi8eZw-4q1ZGRkcXR2ZmdfMTBmeHB4Z2dmNA&hl=en
Notice something? Well, first of all, the Tories are odds on to win in only two Scottish target seats (and only just so in Berwickshire, Roxburgh & Selkirk). If the Tories are to get an overall majority, it won't be based on Scottish seats. Based on the seats in order of their odds, the Tories might do so while winning only Dumfries & Galloway.
Also, unlike the UK national equivalent of Tory targets, there is no dominance at the top of the red. The idea of swing to the Tories from Labour just doesn't seem to work in Scotland. Indeed, in an inversion of what we find in England, the Lib Dem seats with higher swings seem to be seen as easier targets than Labour seats with lower swings. Compare and contrast the best Tory prices in Aberdeenshire West & Kincardineshire and Stirling. The markets seem to think that Tory progress against the SNP is still less likely.
Who next to disappoint? Well, how about the Lib Dems? 13 of their top 100 targets are in Scotland - and I also have included Dunfermline & West Fife in my list of Scottish targets, given their excellent by-election victory there. The markets, however, are wholly unconvinced by their chances:
http://docs.google.com/Doc?docid=0ASgi8eZw-4q1ZGRkcXR2ZmdfMTFjY2RrdmZnZA&hl=en
They are listed at less than 10/1 in only five of their targets and their best price is evens (in their by-election victory seat). As football managers would say, this looks like a season for consolidation at best. Since only tiny swings are needed in three of their targets to take the seats, this is a mark of the extent of Lib Dem failure in Scotland over the last five years.
Labour have 8 Scottish seats in their 100 targets (not that they need them to keep power, of course). Perhaps unsurprisingly, the markets don't expect them to take any of them, with no seat at shorter odds than 11/4:
http://docs.google.com/Doc?docid=0ASgi8eZw-4q1ZGRkcXR2ZmdfMTJnN3piNmRocw&hl=en
It is perhaps a mark of the extent of progress that the SNP have made that Labour is a 9/2 shot in a seat that the SNP hold from them by fewer than 400 votes.
So, the SNP should be licking their lips at major gains, right? Computer says no. I've compiled my own list of the SNP target seats by swing, and here it is:
http://docs.google.com/Doc?docid=0ASgi8eZw-4q1ZGRkcXR2ZmdfMTNkcjlqY2dncA&hl=en
It is glossed over on politicalbetting.com too often, but the swings that are required for the SNP are heroically large in most cases. Only three seats would be taken by the SNP with a swing from the last UK general election of less than 10%. The Tories would take 190 seats with a swing of 10%. Slough, the 190th seat in that category, would be taken by the Tories from 2nd place at odds of 5/2. To compare and contrast, the SNP would take Argyll & Bute from 3rd place on a 10.5% swing at for the same price. I know which bet I'd prefer.
Let's now have a look at SNP seats ranked by odds. They are at evens or better in just three of their targets:
http://docs.google.com/Doc?docid=0ASgi8eZw-4q1ZGRkcXR2ZmdfMTRmM2pjcTNmbQ&hl=en
Frankly, I can see why, given the swings required. You will also note that the SNP are in general weak where the Lib Dems are strong - most of the Lib Dem seats are clustered at the bottom of the table. This is unfortunate in a year when the Lib Dems look like the party with the most problems in Scotland.
But could the seat markets have got this all wrong? In individual seats, doubtless, but I am very doubtful that they are far wrong. The Holyrood elections in 2007 - on which SNP hopes are so often pinned - were now three years ago and were in any case for a different legislative body by a different electoral system. There are no recent opinion polls suggesting the levels of movement in the parties that would result in major seat changes (except perhaps that the Lib Dems are going backwards, and even there recent polling has been more encouraging for them). The last two by-elections in Glenrothes and Glasgow North East seem to suggest that Labour has worked out how to handle an SNP challenge, even in those intense circumstances. We can expect this election to be a no change election in Scotland at least.
What does this mean for betting? Well, I suggest that it means that many of the best bets will be Labour holds. The adventurous might consider a bet on Labour in Dumfries & Galloway, if you take the view that Scotland is immune to Tory charms. If you want to bet on a Tory win against Labour, Stirling on the face of it looks better value than either Renfrewshire East or Edinburgh South West. It would be good to have detail on Perth & North Perthshire, since the 5/4 on a Tory win looks interesting with such a small swing required.
If you take the view that the Lib Dems are falling back, a Labour win in Dunbartonshire East at 11/4 looks interesting. I'm not enthused by the odds on any of the Lib Dem targets. The Lib Dems are going to have their hands full keeping what they already hold.
The odds on SNP wins are getting close to scandalous. 3/1 in Falkirk where a 15% swing is required? Come on. The SNP are 8/1 in Glenrothes, where even in the heat of a by-election they couldn't get close to Labour. The value has to be on the other side of the table with Labour in most such seats. A bet on Labour in Kilmarnock has to be worthwhile and even in Dundee West the red team may well be the value side to back.
One final pair of bets must be mentioned - which have been available at far better prices and touted by Peter from Putney. You can get 0-3 Scottish Conservative seats at 6/4 with Ladbrokes and 6-10 SNP seats at 2/1 with William Hill. Both of these look more like odds-on bets than odds against bets.
Should I get my tin helmet out now?
antifrank
Tell No Lies. How the MSM Will Report the Campaign
In this article Bunnco, your man on the spot, reviews the BBC's Election Reporting Guidelines which will be published in the next few days by The BBC Trust and wonders how the current reporting of the Wild West phoney campaign will change after Gordon goes to see Her Majesty.

Over the last 24 hours there’s been a frenzy of media speculation focused upon whether Gordon really did kill the butler in the library with a length of lead pipe. Or not.
Over all it’s been a good week for Labour, which seems to have owned-the-media-space in a co-ordinated campaign kicking-off with the Tears4Piers show last Sunday. The Tories have hardly had a look-in apart from the unfortunate gaffe from Nick Winterton, rather bemusingly characterised as ‘a senior Tory’, about not being able to get on with his confidential paperwork in standard class on the train to Cheshire.
There’s a perception on the main site that the smallest Tory transgression is seized upon where more substantial Labour problems are glossed-over. In my view, the ‘Nothing to see, move along meme’ does make it difficult to disbelieve that there is an institutional media bias against the Tories. I’ll leave it to others to question why this should be.
So, with Labour’s wall-to-wall coverage, we shouldn’t be surprised that the polls have tightened somewhat. And that apparent narrowing of the polls rather proves Mike’s Third Golden Rule, which states [and here I paraphrase] that the more you’re on the gogglebox, the better you do in the polling.
But this is all about to change because in the election period, strict broadcasting rules apply. The BBC’s Guidelines will be formally published in the next few days but the draft rules have been available on the BBCTrust’s website since December.
The Editorial Guidelines set out the standards required of people making programmes and other content for the BBC. They exist to guide content producers in making considered editorial decisions that take into account their responsibilities to the audience, contributors and others...
…The BBC is required by Parliament under the terms of its Charter and Agreement of 2006 to ensure that matters of political controversy and matters of public policy are covered with due impartiality.
Elections are major matters of political controversy and for elections the BBC produces Election Guidelines in addition to and alongside the standards set by the BBC Editorial Guidelines. The Election Guidelines set out the particular standards set by the BBC during the period leading up to and including an election day. They are additional to the standards set by the BBC to ensure that its content is duly impartial.
I downloaded the draft guidelines this morning and I reproduce the elements, which I think many PB readers will find most useful below: The document is 14 pages long so I have highlighted the key passages below. If you want to read the whole document, you’ll have to download it yourself.
These guidelines come into effect from the day on which the Prime Minister offers his resignation to the Queen and the General Election date is announced – this may well be a longer period and before Parliament is dissolved. The guidelines remain in effect until the close of polls.
These Guidelines are intended to offer a framework within which journalists:
• can operate in as free and creative an environment as possible,
• deliver to audiences impartial and independent reporting of the campaign, giving them fair coverage and rigorous scrutiny of the policies and campaigns of all parties.
The BBC is also required, under the terms of its Charter and Agreement of 2006 to ensure that political issues are covered with due accuracy and impartiality. These Election Guidelines… which say we must ensure that:
• news judgements continue to drive editorial decision making in news based programmes.
• news judgements at election time are made within a framework of democratic debate which ensures that due weight is given to hearing the views and examining and challenging the policies of all parties. Significant minor parties should also receive some network coverage during the campaign.
• we are aware of the different political structures in the four nations of the United Kingdom and that they are reflected in the election coverage of each nation. Programmes shown across the UK should also take this into account.
Mandatory issues and referrals
During the Election Period:
• Any programme which does not usually cover political subjects or normally invite politicians to participate must consult the Chief Adviser Politics before finalising any plans to do so.
• All bids for interviews with party leaders must be referred to the Chief Adviser Politics before parties are approached. Offers of such interviews should also be referred before being accepted
• Any proposal to use a contribution from a politician without an opportunity for comment or response from other parties must be referred to a senior editorial figure and the Chief Adviser Politics.
• The BBC will not commission voting intention polls
• Any proposal to commission an opinion poll on politics or any other matter of public policy for any BBC service must be referred to the Chief Adviser Politics for approval.
• There will be no online votes or SMS/text votes attempting to quantify support for a party, a politician or a party political policy issue.
• Any proposal to conduct text voting on any political issue that could have a bearing on any of the elections must be discussed with the Chief Adviser, Politics, as well as being referred to the relevant departmental senior editorial figure and ITACU.
• The BBC will not broadcast or publish numbers of e-mails, texts or other communications received on either side of any issue connected to the campaign.
On Polling day:
• No opinion poll on any issue relating to the election may be published.
• There will be no coverage of any of the election campaigns on any BBC outlet.
• It is a criminal offence to broadcast anything about the way in which people have voted in that election.
Impartiality and Coverage of the Parties
To achieve due impartiality, each bulletin, programme or programme strand, as well as online and interactive services, for each election, must ensure that the parties are covered proportionately over an appropriate period, normally across a week. This means taking into account levels of past and current electoral support.
Due impartiality must be achieved within these categories:
• clips
• interviews/discussions of up to 10 minutes
• longer form programmes
Previous electoral support in equivalent elections is the starting point for making judgements about the proportionate levels of coverage between parties. However, other factors can be taken into account where appropriate, including evidence of variation in levels of support in more recent elections, changed political circumstances (e.g. new parties or party splits) as well as other evidence of current support. The number of candidates a party is standing may also be a factor.
Impartiality in Programmes
Daily news magazine programmes (in the nations, regions and UK wide) should normally achieve proportional and appropriate coverage within the course of each week of the campaign. This means that each strand (e.g. a drive time show on radio) is responsible for reaching its own targets within the week and cannot rely on other outlets at different times of day (e.g. the breakfast show) to do so for it.
Programme strands should avoid individual editions getting badly out of kilter. There may be days when inevitably one party dominates the news agenda, e.g. when party manifestos are launched, but in that case care must be taken to ensure that appropriate coverage is given to other manifesto launches on the relevant days.
The News Channel and television and radio summaries will divide the 24 hour day into blocks and aim to achieve due impartiality across a week’s output in each one. Weekly programmes, or running series within daily sequence programmes, which focus on one party or another, should trail both forward and backwards so that it is clear to the audience that due impartiality is built in over time. In these instances, due impartiality should be achieved over the course of the campaign.
Any programme or content giving coverage to any of the elections must achieve due impartiality overall among parties during the course of the whole campaign. In all elections, the BBC must take care to prevent candidates being given an unfair advantage, for instance, where a candidate’s name is featured through depicting posters or rosettes etc.
Order of Parties
The order in which parties appear in packages or are introduced in discussions should normally be editorially driven. However, programme makers should take care to ensure they vary this order, where appropriate, so that no fixed pattern emerges in the course of the campaign.
Online
The same guidelines as those for programmes will apply to BBC Editorial content on all bbc.co.uk sites. These will apply to audio and video content as well as text content, e.g. blogs, podcasts and downloads, as well as any social networking which is associated with the BBC, including third party sites.
With user generated content, we must not seek to achieve what might be considered “artificial” impartiality by giving a misleading account of the weight of opinion. All sites prompting debate on the election will be actively hosted and properly moderated to encourage a wide range of views. Sites which do not usually engage in political issues should normally seek advice from the Chief Adviser, Politics, before doing so.
There will be no online votes attempting to quantify support for a party, politician or policy issue during the election period.
News Online will not link to the sites of single candidates, unless there is a very strong editorial justification on news grounds and then only for a limited period (e.g. a big row because major player publishes policy on his/her website which contradicts manifesto on their party’s website).
Any speeches which are carried in full will be selected on news value, while bearing in mind that due impartiality requires that an appropriate range of speeches are carried.
Reporting Polls
During the campaign our reporting of opinion polls should take into account three key factors:
• they are part of the story of the campaign and audiences should, where appropriate, be informed about them;
• context is essential, and we must ensure the accuracy and appropriateness of the language used in reporting them;
• polls can be wrong - there are real dangers in only reporting the most “newsworthy” polls – i.e. those which, on a one-off basis, show dramatic movement.
So, the general rules and guidance about reporting polls need to be scrupulously followed. They are:
• not to lead a news bulletin or programme simply with the results of a voting intention poll;
• not to headline the results of a voting intention poll unless it has prompted a story which itself deserves a headline and reference to the poll’s findings is necessary to make sense of it;
• not to rely on the interpretation given to a poll’s results by the organisation or publication which commissioned it, but to come to our own view by looking at the questions, the results and the trend;
• to report the findings of voting intentions polls in the context of trend. The trend may consist of the results of all major polls over a period or may be limited to the change in a single pollster’s findings. Poll results which defy trends without convincing explanation should be treated with particular scepticism and caution;
• not to use language which gives greater credibility to the polls than they deserve: polls “suggest” but never “prove” or even “show”;
• to report the expected margin of error if the gap between the contenders is within the margin. On television and online, graphics should always show the margin of error;
• to report the organisation which carried out the poll and the organisation or publication which commissioned it;
Take particular care with newspaper reviews. Polls should not be the lead item in a newspaper review and should always be reported with a sentence of context (e.g: “that’s rather out of line with other polls this week”).
Commissioning Polls
The BBC does not commission voting intention opinion polls during election periods. Editorial Guidelines say “any proposal to commission an opinion poll on politics or any other matter of public policy for any BBC service must be referred to the Chief Adviser Politics for approval”.
Care must be taken to ensure that any poll commissioned by the BBC is not used to suggest a BBC view on a particular policy or issue. A poll may be commissioned to help inform the audience’s understanding of a current controversy, but it should not be used to imply BBC intervention in a current controversy.
The Complaints Unit
The BBC will run a co-ordinated fast response unit which will handle any complaints about political bias during the General Election campaign.
The aim of the unit will be to:
• provide a one-stop shop for complaints-handling by the BBC.
• take pressure off individual journalists so they can concentrate on the journalism.
• reduce duplication of effort and cut down on the time BBC staff have to devote to dealing with complaints.
• try to achieve consistency of response.
• build up any picture of the pattern of complaints, especially from individual political parties.

So, what does all this mean for the Campaign itself and the effect on Polling and the Ballot.
1 I think we’re seeing that the Tory lead has been pretty stable over the last few months hovering around the 38-40% mark. Where we’ve seen changes, it’s tended to be as a result of the inter-play between Labour and the LibDems. As the ‘Others’ value has fallen over time, this has boosted the pool that both Labour & Libdems are fishing in.
As the BBC will be required to give more prominence to Nick Clegg when the election is called, we can expect his share to increase, probably at the expense of Labour.
“Others” may stabilise. In NorwichNorth, many Labour voters protested by supporting the minor parties, especially UKIP. Giving the minor parties a fair crack of the whip on the telly might start to crystallise the 40/30/20/10 polling.
As Bob Worcester so wisely said some weeks ago, “It’s the share not the lead.” What this tells me is that if the LibDems start do better in the campaign as a result of a higher media profile, I can see the Tory lead increasing even if they continue to hover at 40% as Labour leaks to the LibDems.
2 We know what happened in the Autumn with YouGov’s daily Conference Polling. It was jumping around all over the place. But when the Tory Conference came to town, the Tories benefited from saturation coverage. Cameron’s been squeezed-out over the last week so it’s not surprising the Tory share has slipped. If the BBC has to give equal coverage to the Tories his visibility and his polling is sure to rise.
3 Gordon Brown is ill-suited to being door-stepped and he’ll be under a lot of scrutiny in a 17 working day campaign. It seems to me that his lexicon is very restricted. “For the many, not the few”; “Schools and Hospitals”; “Hard-working Families” etc. If he keeps repeating these lines and doesn’t develop new ones in the full glare of media scrutiny, the public will quickly suss this out. The ability of Mandleson to carefully hand-craft the message for set-piece occasions will be limited. Seventeen working days is a long time in Politics.
4 Events: Remember the Battle of Jennifer’s Ear? There’ll be more banana skins like that.
5 Blogging: I’m intrigued by the way in which Iain Dale and Guido are breaking stories. Whilst not many people read their blogs in the wider electorate, they can set the narrative. Neither of these two are subject to media rules and it will be interesting to see how the BBC [& Sky] treat new blogosphere stories as they break. I’m surprised the guidelines don’t include a section on the blogosphere and other [non-BBC] electronic media.
6 The Leaders’ Debates. This is the big unknown and even now it’s not clear whether these will actually happen.
7 Reporting of Polling. There’s quite a chapter on this and PB has a role here to assist the BBC and other media outlets in interpreting what’s going on. I really hope that the site doesn’t just degenerate into a series of name-calling or willy-waving threads. This is where we collectively earn our spurs.
But after a week of saturation coverage when the starting gun is fired, I suspect that we’ll be longing for election day, whenever it is. Why? Because the BBC guidelines are quite clear
There will be no coverage of any of the election campaigns on polling day, from 6am until polls close at 10pm on TV, radio or bbc.co.uk. However, online sites will not have to remove archive reports. Coverage will be restricted to factual accounts with nothing which could be construed as influencing the ballots. No opinion poll on any issue relating to politics or the election may be published until after the polls have closed. Whilst the polls are open, it is a criminal offence to broadcast anything about the way in which people have voted in that election.
And the day after that? What are we all going to do with all our time then? After the excitement of the Norwich North by-election last year I told my wife that the aftermath was like having a bereavement in the family. I’m sure it will be the same for some of you too.
Bunnco – Your Man on the Spot
Saturday 20 February 2010
What’s Going on in the Marginals? It's the Councils Stupid.
I kicked off this short series of articles on why the marginals might be behaving differently on Tuesday by suggesting that part of the apparent disproportionate swing from Labour in these key constituencies might be as a result of over a million ‘council house tenants’ now being landlorded by independent ‘Registered Social Landlords as the result of the LSVT process.

The Town Hall
It was a quirky and unusual analysis to kick-off with and many of the initial responses reckoned that the reason the Tories might be doing better in the battleground towns was simply because they’re in putting more effort in these seats.
That’s true of course. And this article attempts to help you understand why that might be. The Labour Party tries to claim that effort in the marginals is simply as a result of the ‘Ashcroft money’. But as always, the truth is a little more complicated than that. The Tories just have more people on the ground.
In his seminal 2007 PB post, Blair Freebairn said that “It’s the towns, stupid” and in METHHs where the election will be decided.
That these marginal seats will decide the next election is not news. But look at the pattern the 201 marginal seats highlighted make. They don’t concentrate in Wales, Scotland, London, the major cities or the truly rural areas. They aren’t really regional. They are heavily concentrated in Medium English Towns and Their Hinterlands (METTHs from now on).
For many years Colin Rallings and Michael Thrasher in the School of Sociology, Politics & Law at the University of Plymouth have written extensively on electoral systems, results and British politics. Their articles in the Local Government Chronicle and UKPolling have a wide following. And every year their work is used to help compile an authoritative Parliamentary Report into the Local Elections for that year.
So if you want to know what’s been going on in the METHHs during the last 15-20 years or so, Plymouth is the place to start. And particularly in an experimental page hidden away on Ralling/Thrasher’s website where there’s a clunky animation of Local Council Control between 1974-2007
Many people are talking about 2010 being a ‘change election’. They seem to come along every 10-15 years or so, most recently in 1979 and 1997. So, according to Rallings/Thrasher, what was local council control like on the two ‘change election’ occasions?

Click on the pictures to see them bigger
Notice anything? Getting Warmer? No wonder Labour enjoyed a landslide in 1997. There wasn’t anyone left to deliver the Tory leaflets! They'd got a stranglehold on local government.
It shouldn’t really be surprising that the local election results provide a good litmus test of what’s going on in the world of local politics where elections are won or lost.
So, if Andy Cooke’s analysis is correct, there should be some ‘unwind’ from the 1997 Parliamentary elections. If so, I wonder what the Council elections since 1997 are telling us about this.
So let’s do that for the two general election years that followed the Blair's 97 landslide.

Getting Colder. Notice how the number of blue dots seems to be getting more dominant.
And now, let’s fast forward to 2007 and 2009, the most recent year that the districts and counties last elected. Every year the House of Commons librarians publish a research paper into the Local Council Elections, relying heavily on Rallings and Thrashers’ work. Here are the links for 2007 & 2009
[The Parliamentary library seems to have picked-up the mapping responsibilities, which is why the map’s in a different format.]

Crikey! In 2009, there was no red left! That should be telling us something. Here’s some pretty solid evidence for Andy Cooke’s 1997 unwind theory and also the Constituency effect.
However Labour try to spin it, it’s going to be difficult to pin all this onto Lord Ashcroft.
And, from the 2009 Parliamentary paper are the numbers that underline those maps.

The Tories now have more councillors than Labour or the LibDems combined. And more than three-and-a-half as many councils as the principle opposition parties.
The non-political Local Government Association represents the four sorts of councils in England: the Metropolitan Unitaries, the new Rural Unitaries, the Counties and the most numerous Districts. Every week they publish a magazine called First for their members and in the one that followed last June’s election Rallings & Thrasher tell us what happened on page 7.
The local government map is bluer now that at any time for more than 30 years. The Conservatives seized control of all six counties being defended by either Labour or the Lib Dems, as well as emerging as the largest party in the former Lib Dem fiefdom of Cornwall. They notched up net gains of nearly 300 seats.
The Liberal Democrats had the consolation of securing an overall majority in Bristol, as well as picking off primarily Labour seats in councils as far apart as Cumbria and West Sussex. However they did lose about 50 seats overall, not least because of their setbacks in Cornwall, Devon and Somerset.
For Labour there was nowhere to hide. They lost more than 300 seats; their share of the vote fell in virtually every division and ward; in 19 of the 34 councils with elections theynow have three or less elected councillors; and they won fewer seats than in the comparable contests at their previous nadir in 1977. In Derbyshire, on paper their safest county, they lost 16 seats following double figure swings to the Conservatives; in Staffordshire they collapsed from 32 seats to just three.
And whilst the table above gives the June 2009 snap-shot, the table and graph below put it into an historic perspective.

It all started to go wrong for Labour in 2003, when the Tories overtook them on local Councils.
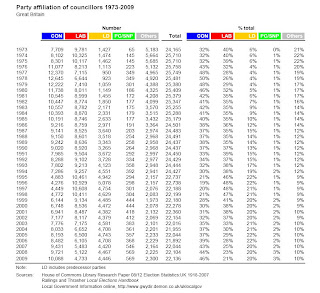
Ok, so that’s enough data, what does it mean?
As important as local politicians like to think they are, the most astute know their place in the food chain. Their real value is campaigning for the Main Event. The General.
When it comes to elections, the parties need people to canvass, deliver leaflets and sit outside polling stations. The people who do all of this work are mainly the 'payroll vote' - the local Councillors from councils across the country. And not just councillors, but their friends and relatives. There's quite an army.
And you can see that the Tories now have more councillors that Labour or the LibDems combined. And these Tories are concentrated where the Party needs them most. In the District councils. And the district councils are in the METHHs. And as Blair Freebairn said. “It’s the Towns Stupid.”
No wonder, Iain Dale has been highlighting the pickle that John Denham’s got himself into regarding Local Government Reorganisation. The naked politics of the move has left even neutral observers like the FT’s Sue Cameron breathless.
In 2004 Bunnco met Sandy Bruce-Lockhart. He’s sadly dead now but at the time he was a leading light in Local Government Circles. He told me that that Labour was planning a wholesale move to large ‘unitary’ councils in order to destroy the Tories campaigning base in the shires. Getting rid of the local District Councils would decimate Tory numbers and let Labour wrest control of the LGA. No wonder, Eric Pickles keeps a pearl handled revolver in his drawer. He knows the importance of the Councillor-base to his Party.
Two weeks ago, Tory Council Leaders flexed their muscles in a letter to the Telegraph
SIR – As leaders of Conservative local authorities, we are sick of hearing Labour ministers crowing about how they have helped keep council tax down this year. Readers should be aware that we have managed to keep taxes low in our authorities despite the efforts of John Denham and his department. Labour red tape has led to the unprecedented council tax increases since 1997. The average increase is so low this year through a combination of two factors. First, Conservative authorities have been committed, as always, to efficient and low-cost public services. Second, with every passing year, more high-tax Labour councils are failing at the ballot box.
Labour may try to paint the Tories as novices and untried. But when millions of council tax demands drop onto doormats from the first week of March showing Council Tax has been frozen in many Conservative areas, it’s going to be difficult for Labour to regain the momentum.
The Tories picked themselves up after 1997 as Labour must do now starting at the local level.
And of course, it’s this realisation that is troubling Gordon Brown as he chooses the election date. He knows it’s best for the Parliamentary party to go early but May 6th would at least salvage some councillors from the wreckage in the Metropolitan Councils that poll on that day.
Labour keep banging-on about how there isn’t a single Conservative Councillor in Manchester, conveniently forgetting that Tories control neighbouring Trafford.
But Tories don’t need to win seats in these conurbations to win a Parliamentary majority. They need to win in the METHHs. And as this article has shown, that's where the Tories are in the driving seat for the moment.
Bunnco - Your Man on the Spot
Tuesday 16 February 2010
Constituency betting - choosing which Tory targets to back
With Ladbrokes having now put up odds on every constituency in the UK, we are now well-placed to judge just exactly which seats offer the best prospects for the thoughtful better. While they do not represent the only betting opportunities, the seats that the Tories hope to take must form the centrepiece of our thoughts. Perhaps unsurprisingly, the bookies present the seats in a manner that suits their interests. It is more helpful, however, to set them out in a more logical way.
I attach a link to the top 200 Conservative target seats as judged by swing, according to Anthony Wells and have included a column with the best price on the Conservatives with the six bookies offering prices:
http://docs.google.com/Doc?docid=0ASgi8eZw-4q1ZGRkcXR2ZmdfN2c1cHB3eGM3&hl=en
It will immediately be apparent that there is only a loose link between size of swing and the odds quoted.
The point can be made still more starkly if we rank these 200 seats not by swing but by length of odds:
http://docs.google.com/Doc?docid=0ASgi8eZw-4q1ZGRkcXR2ZmdfNGdxaHFwNGZ0&hl=en
Instantly the colour code changes from a fairly random mix of red, yellow and grey to a sea of red up to seat 60, when the first Lib Dem seat appears. The bookies (or punters) are confident that this election is going to about swing against Labour.
Notice anything about the band from 10/11 to 11/10? Ten out of nineteen seats in this range are Lib Dem held, far beyond the number you would expect at random. Nobody really knows anything about how the Lib Dems are going to hold out against the Tory tide. Also in this band is Watford, a seat that has given rise to a Mrs Merton style heated debate between JackW, our host and others. Bet in these seats on the basis of inside knowledge or according to prejudice.
Can we make more constructive comments elsewhere? Well, the Tories notionally have 214 seats and would need 326 for a majority of 2, so would need to take 112 extra seats. Seat number 112 (as ranked by odds) is Amber Valley, at odds of 8/11. While the Tories don't need to take this seat specifically, they will have to take this seat or one at the same or longer odds to get an absolute majority. Meanwhile, the bookies offer 1/2 for an absolute majority. If you can find the right marginal (or book of marginals), you can do much better on constituency betting than on that market. Look for the most normal looking marginal in that band with the fewest special considerations, and hey presto, you've turned a 1/2 bet into an 8/11 bet. Just pray that the Tory candidate doesn't then run off with a choirboy.
If you're less sanguine about Tory chances, note that they need about 65 extra seats to be the largest party. 65th in the list is Waveney at 1/3. Most bookies are quoting about 1/12 on the Tories having the most seats. So there are value bets here as well.
Another way to look for possible bets is as follows. Look at how far from its rank on swing basis a seat is when ranked by odds. The further away that it is from its par ranking, the greater the special factors needed to justify it. To take an example, Westmorland & Lonsdale is the 14th Tory target as ranked by swing. However, it ranks a lowly 173rd in the table of odds. Why is it so far adrift? You need to be very sure that the incumbency of the current Lib Dem MP is going to see him through. (As it happens, I am.)
When doing this, you need to be very aware that Labour seats often look as though they have artificially low rankings by swing, given that the swing will be against them rather than the Lib Dems. An absolutely stand-out bet (for me) is Nuneaton. Its theoretical ranking is 85th by swing and 98th by odds. When you consider that there are a further 13 Lib Dem seats that rank higher by swing but lower by odds, the differential in terms of Labour seats alone is 26. There are of course also more complicated Labour seats with justly longer Tory odds. I cannot see any justification for the length of the price in Nuneaton. Erewash, where a considerably higher swing is needed, is at a shorter price.
Dagenham & Rainham also looks like a good bet. You need to be very sure that Jon Cruddas is worth swing to decide otherwise. I like him a lot (and might well vote for him if I lived in his constituency) but I fear for his chances.
In short, when considering in which seats to bet on Tory chances, don't think of the seats in isolation. Look at the prospects relative to each other. It is of course permissible to conclude that the Tory chances aren't as good as the main markets would suggest, but if they poll at the levels that the opinion polls are currently suggesting, their votes have to go somewhere. These lists should help you decide how they might be most profitably spread for you.
antifrank
Subscribe to:
Posts (Atom)